15 KiB
Observability Stack — Prometheus, Grafana, Loki on Incus
A lightweight observability stack deployed as Incus containers on the lab cluster. Provides metric collection (Prometheus), dashboards (Grafana), and log aggregation (Loki) for Incus nodes, HAProxy load balancers, and host-level resources.
The stack runs entirely on OVN and is managed by the deploy-observability
script. All containers use the monitoring-allow ACL to permit scrape
traffic on the shared network.
Architecture
flowchart TD
    lan(["LAN 192.168.103.0/24"])

    subgraph fwd["OVN Forward · 192.168.103.201"]
        fwd_grafana[":3000 → Grafana"]
        fwd_prom[":9090 → Prometheus"]
    end

    subgraph mon["monitoring · 10.10.10.70 · oc-node-02"]
        prometheus["Prometheus :9090"]
        grafana["Grafana :3000"]
        loki["Loki :3100<br/>gRPC :9096"]
        promtail["Promtail"]
    end

    subgraph targets["Scrape Targets"]
        incus["Incus nodes :8443<br/>.140 · .141 · .142"]
        haproxy["HAProxy :8404<br/>.50 · .51"]
        ne["node-exporters :9100<br/>.71 · .72 · .73"]
    end

    lan --> fwd
    fwd --> mon
    prometheus -->|"client cert"| incus
    prometheus --> haproxy
    prometheus --> ne

    classDef external fill:#f5f5f5,color:#333,stroke:#999
    classDef network fill:#0072B2,color:#fff,stroke:#005a8e
    classDef mgmt fill:#CC79A7,color:#fff,stroke:#a36088
    classDef instance fill:#56B4E9,color:#fff,stroke:#3a8fbf
    classDef node fill:#009E73,color:#fff,stroke:#007a5e

    class lan external
    class fwd_grafana,fwd_prom network
    class prometheus,grafana,loki,promtail mgmt
    class incus,haproxy,ne instance

    style fwd fill:#e0eef8,stroke:#0072B2
    style mon fill:#f5e6f0,stroke:#CC79A7
    style targets fill:#e0f2fe,stroke:#56B4E9
Components
Prometheus 2.54
Metric collection engine. Scrapes all targets at a 15-second interval.
- Stores metrics locally in the monitoring container
- Client certificate authentication for Incus
/1.0/metricsendpoints (uses cluster client cert + key) - Plain HTTP scrape for HAProxy stats (
:8404/metrics) and node-exporters (:9100/metrics)
Grafana 12.4
Dashboard and visualization frontend.
- Default credentials:
admin/admin - Pre-provisioned datasources for Prometheus and Loki
- Nine dashboards deployed automatically (see Dashboards section)
- Accessible from LAN via OVN network forward
Loki 3.6
Log aggregation backend.
- HTTP API on port 3100
- gRPC on port 9096 (not the default 9095 -- avoids conflict with Promtail's own metrics port)
- 7-day retention policy
- Receives logs from Promtail running in the same container
Promtail 3.6
Log shipping agent, co-located with Loki in the monitoring container.
- Pushes logs to Loki via gRPC on localhost:9096
- Scrapes container logs and system journal
node_exporter
Host-level metrics via privileged Alpine containers.
- One container per cluster node, pinned with
--targetplacement - Privileged containers with host filesystem bind-mounts:
/proc(host) ->/host/proc(read-only)/sys(host) ->/host/sys(read-only)/(host) ->/host/rootfs(read-only)
- Exposes standard node_exporter metrics on
:9100 - Uses
monitoring-allowACL for network access
Access
| Service | URL | Credentials |
|---|---|---|
| Grafana | http://192.168.103.201:3000 | admin / admin |
| Prometheus | http://192.168.103.201:9090 | None (open) |
Both services are accessible from the LAN through an OVN network forward
on IP 192.168.103.201. The forward maps external ports directly to the
monitoring container's internal ports (no translation).
Prometheus and Loki are not exposed externally by default. They are accessible only from within the OVN network or through the Grafana datasource proxy.
Dashboards
Nine dashboards are provisioned automatically during deployment, organized into four Grafana folders. All dashboards support template variables for filtering and include cross-dashboard navigation links.
Use manage-dashboards to install, export, validate, or list dashboards:
incusos/manage-dashboards --install     # push all dashboards to Grafana
incusos/manage-dashboards --list        # show install status
incusos/manage-dashboards --validate    # check JSON quality
incusos/manage-dashboards --export      # export from Grafana to clean JSON
incusos/manage-dashboards --status      # compare local vs installed
Incus Cluster — Incus Cluster Overview
Overview of all instances with instance/node template variables.
- Instance count, total CPUs, total memory, cluster memory utilization gauge
- Instance status table with drill-down links to Instance Deep Dive
- Per-instance CPU usage, active memory, memory usage % bar gauge
- Network receive/transmit rates, disk read/write rates
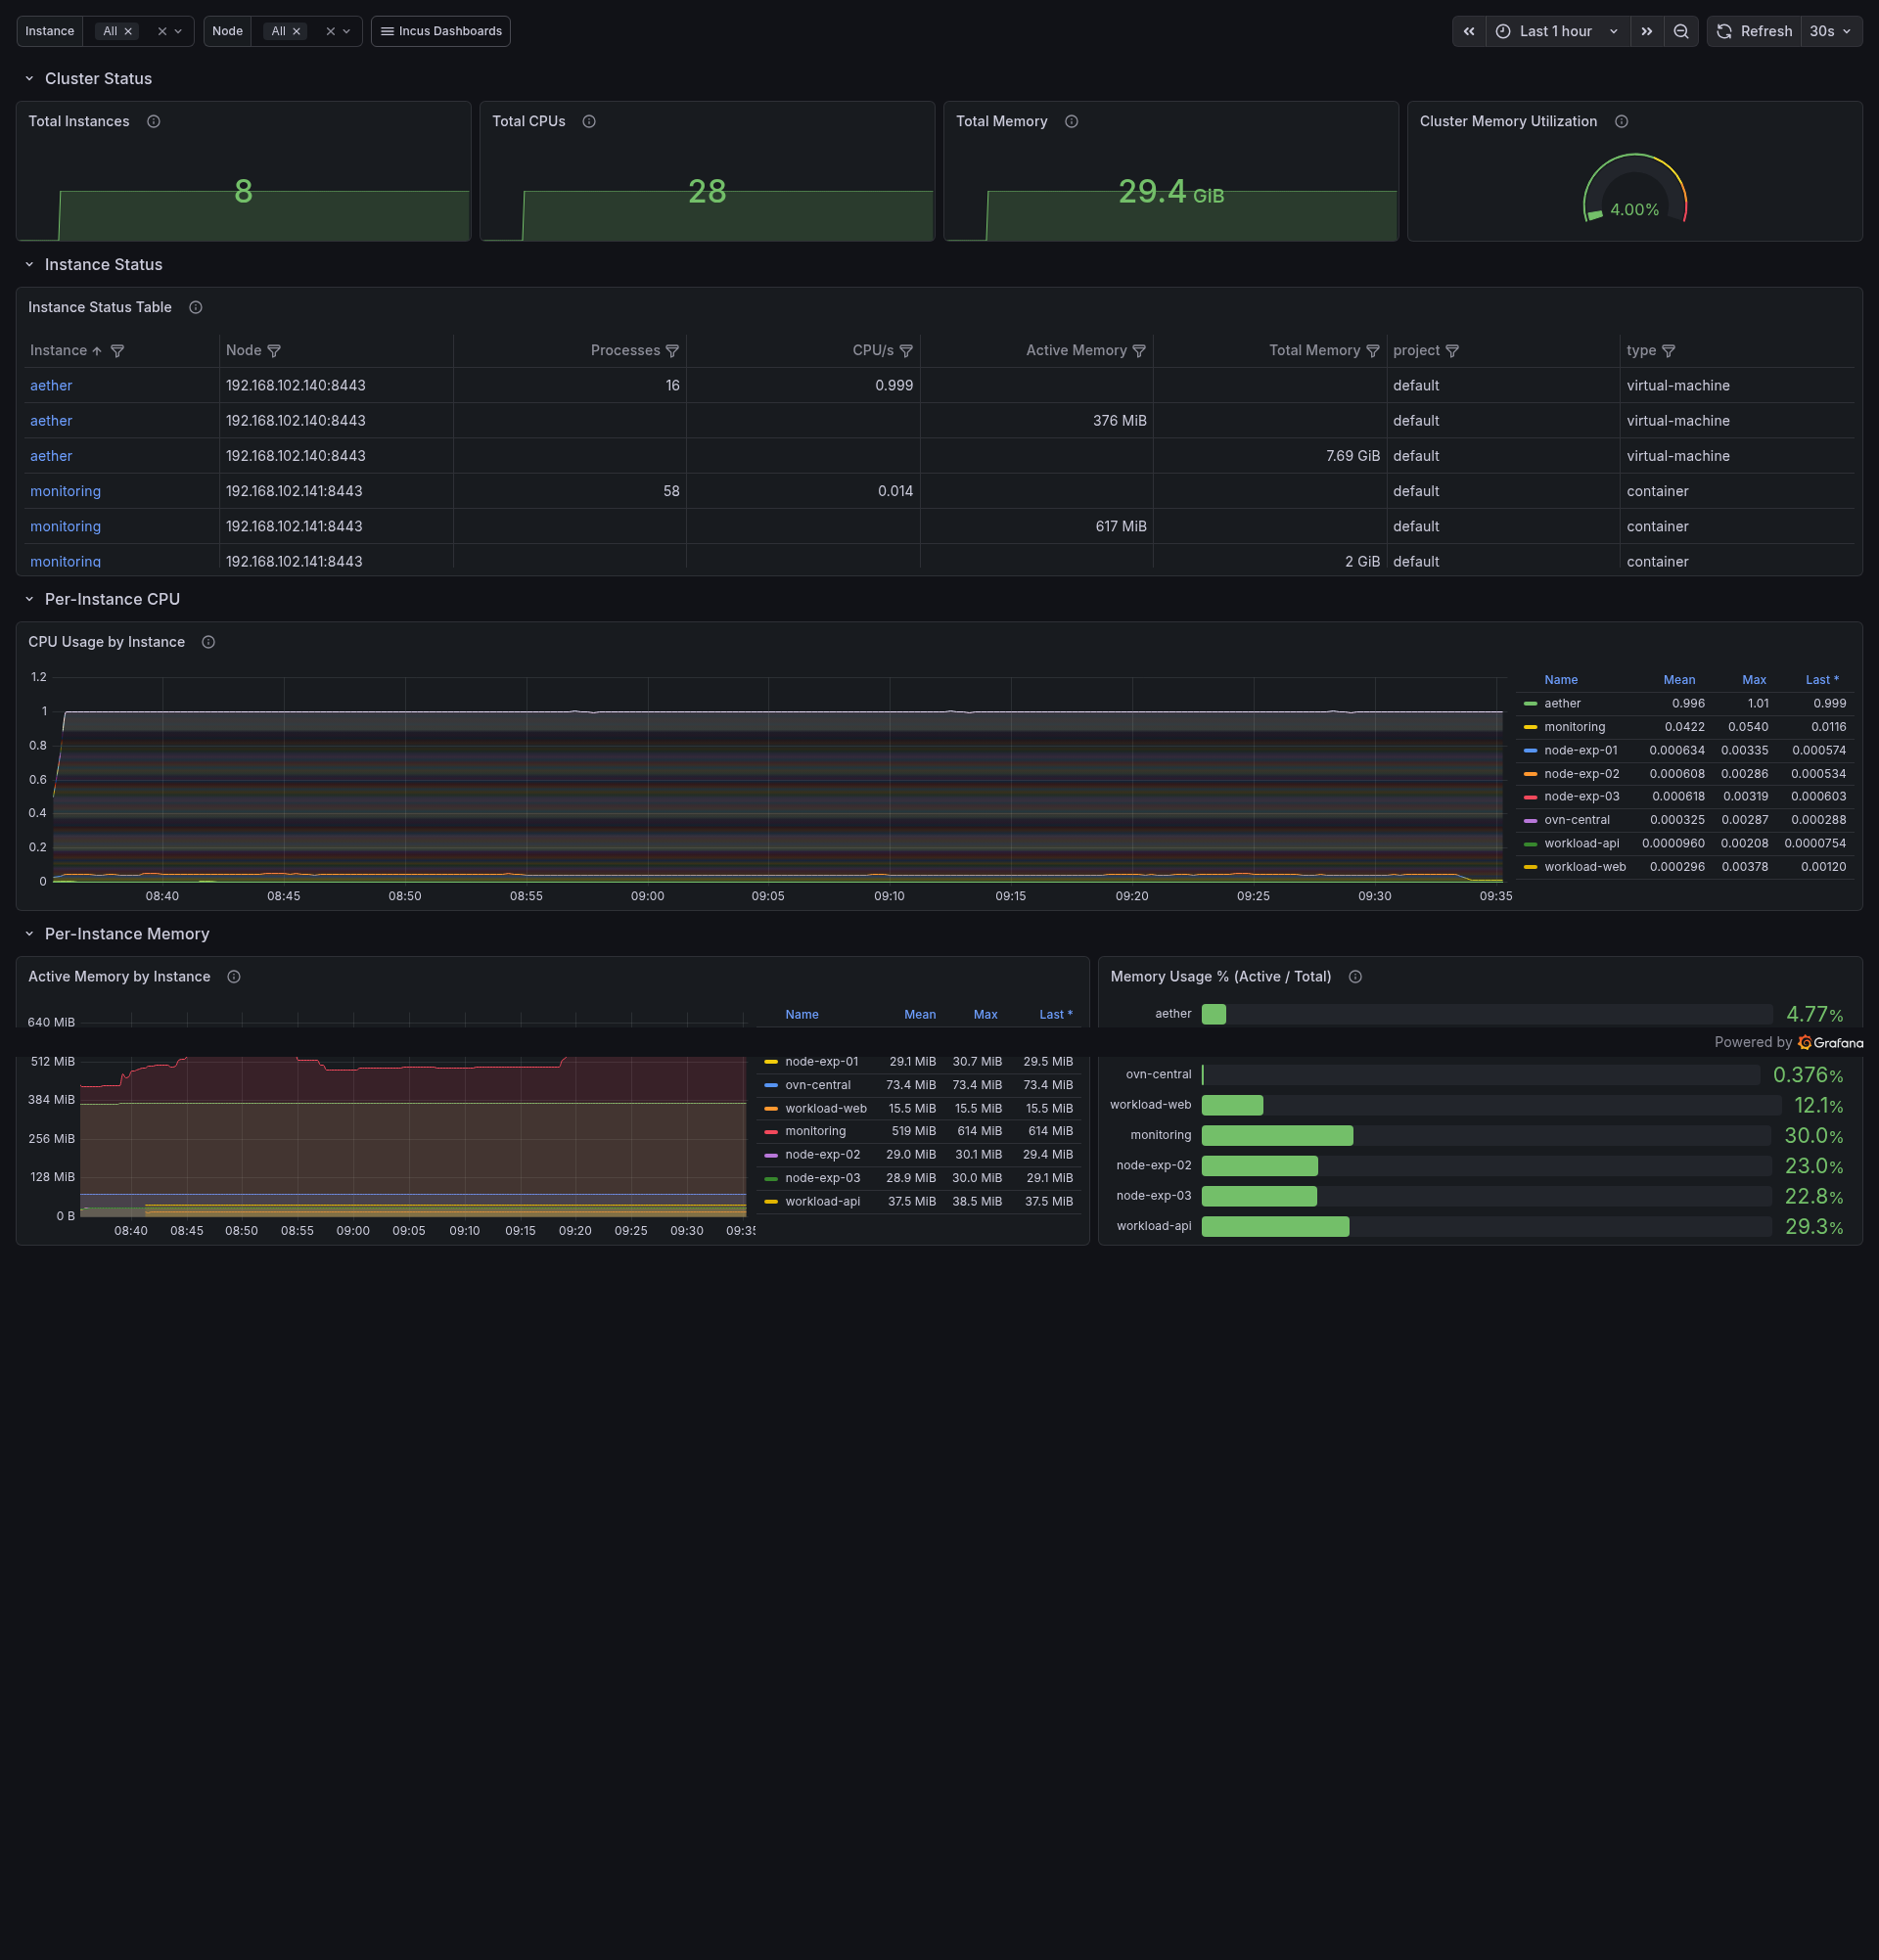 Cluster-wide view showing 8 instances across 3 nodes with 28 total CPUs,
active memory utilization, and the instance status table.
Cluster-wide view showing 8 instances across 3 nodes with 28 total CPUs,
active memory utilization, and the instance status table.
Incus Cluster — Instance Deep Dive
Single-instance drill-down selected via template variable.
- Processes, effective CPUs, total memory, memory utilization gauge
- CPU usage over time with gradient color scheme
- Active memory and memory utilization % over time
- Network traffic (receive above axis, transmit below on same panel)
- Disk read/write rates
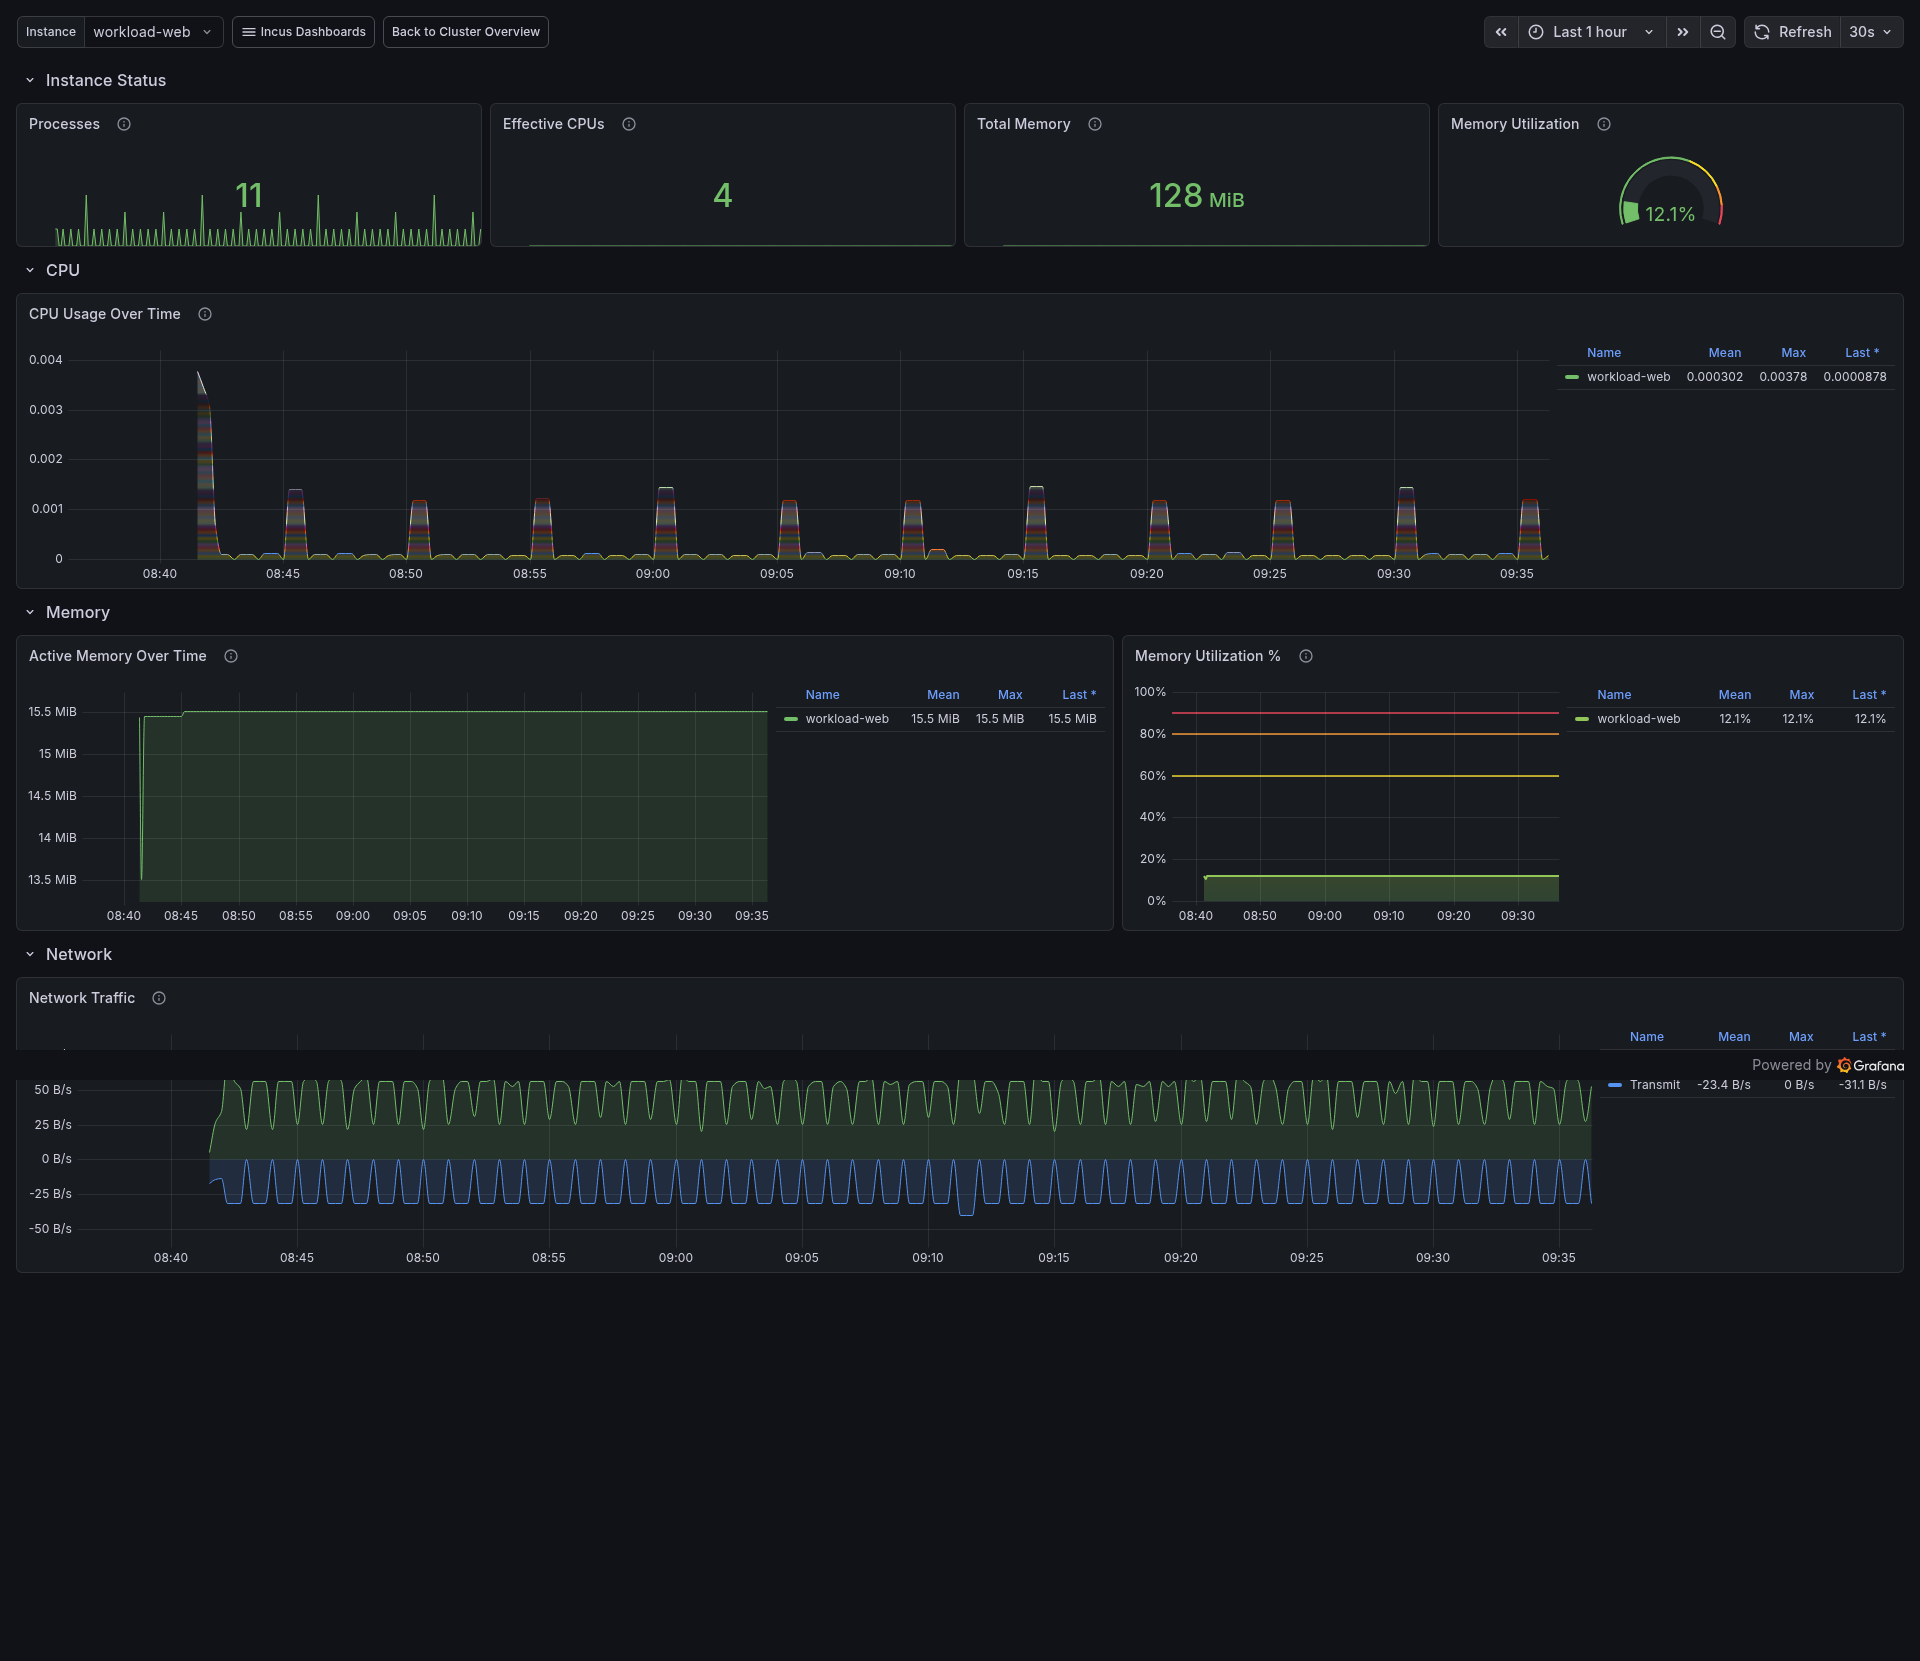 Deep dive into workload-web showing 11 processes, 4 effective CPUs, 128 MiB
total memory, and per-metric time series for CPU, memory, network, and disk.
Deep dive into workload-web showing 11 processes, 4 effective CPUs, 128 MiB
total memory, and per-metric time series for CPU, memory, network, and disk.
Incus Services — HAProxy Traffic
HAProxy monitoring with proxy/server template variables.
- Active servers, current sessions, HTTP request rate
- HTTP 4xx/5xx rate stat panels with warning thresholds
- Response code distribution (stacked, color-coded by class)
- Backend status table and server status state timeline
- Frontend traffic, sessions by proxy, response times
- Queue time and connection errors
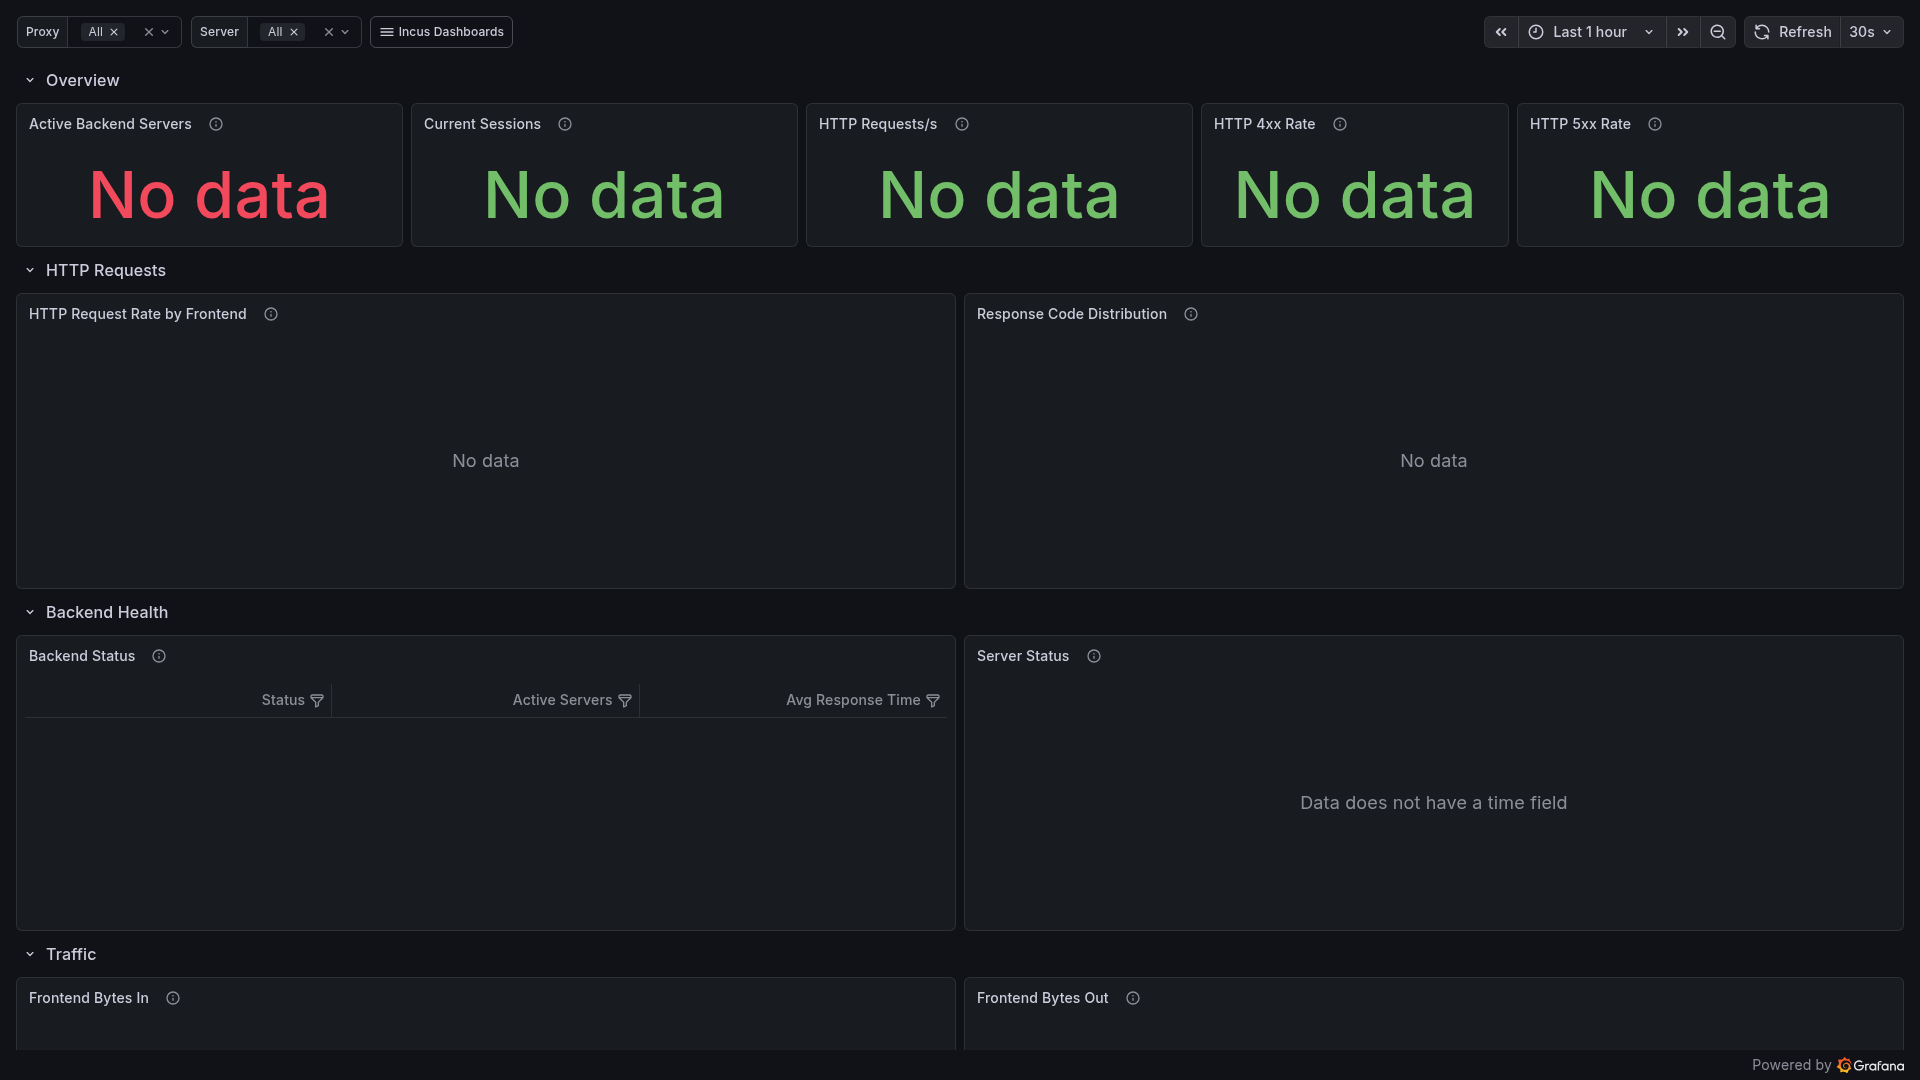 HAProxy dashboard showing panel layout. Panels display "No data" when
HAProxy instances are not deployed or their stats endpoints are unreachable.
HAProxy dashboard showing panel layout. Panels display "No data" when
HAProxy instances are not deployed or their stats endpoints are unreachable.
Incus Infrastructure — Host Resources (IncusOS Nodes)
Physical host monitoring with node template variable.
- System information table (kernel, uptime, RAM, CPU count)
- CPU usage % and CPU mode breakdown (user/system/iowait/idle stacked)
- Load average (1m/5m/15m) with CPU count threshold line
- Memory usage % and memory breakdown (used/buffers/cached/available)
- Filesystem usage % bar gauge, IOPS, disk I/O time
- Network traffic by device, network errors and drops
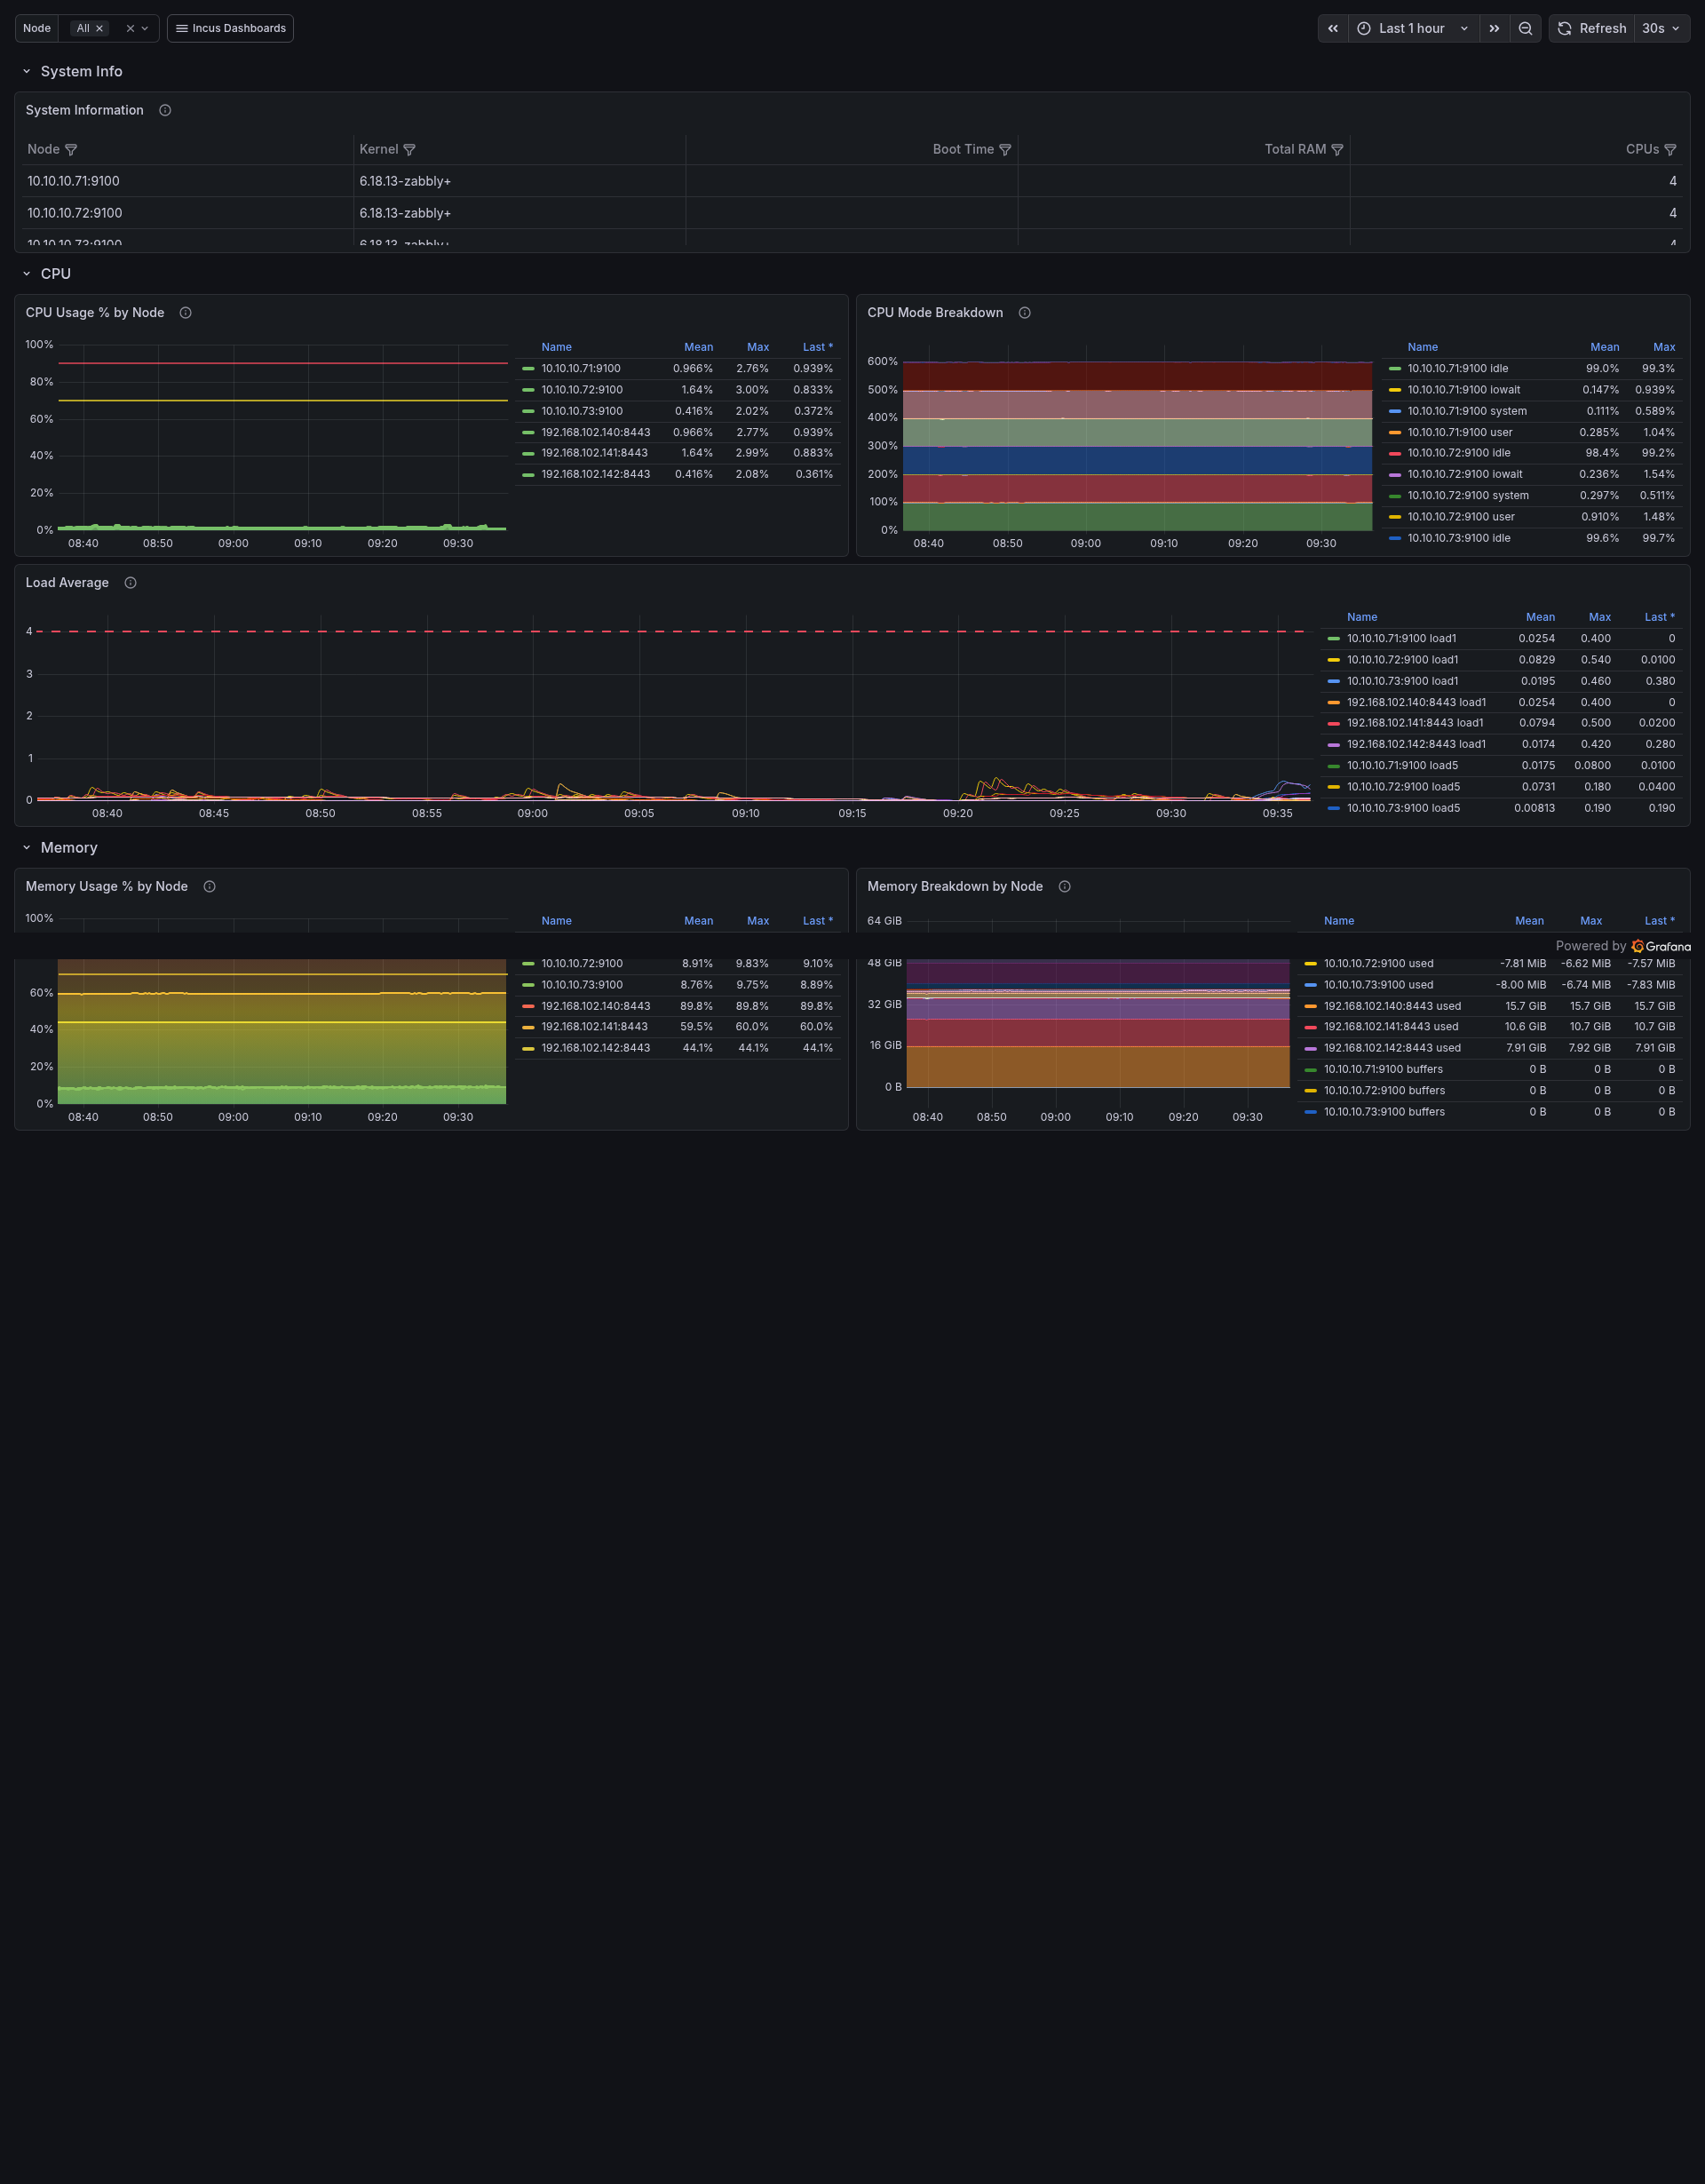 Host-level metrics from node-exporter showing system info, CPU/memory
breakdown, filesystem usage, and network traffic for all 3 IncusOS nodes.
Host-level metrics from node-exporter showing system info, CPU/memory
breakdown, filesystem usage, and network traffic for all 3 IncusOS nodes.
Incus Infrastructure — Storage & Filesystem
Filesystem and disk I/O with node/mountpoint template variables.
- Filesystem usage table with color-coded Used % column
- Available space trend over time
- Disk read/write throughput by device
- Average read/write latency, disk utilization %
- Inode usage % bar gauge
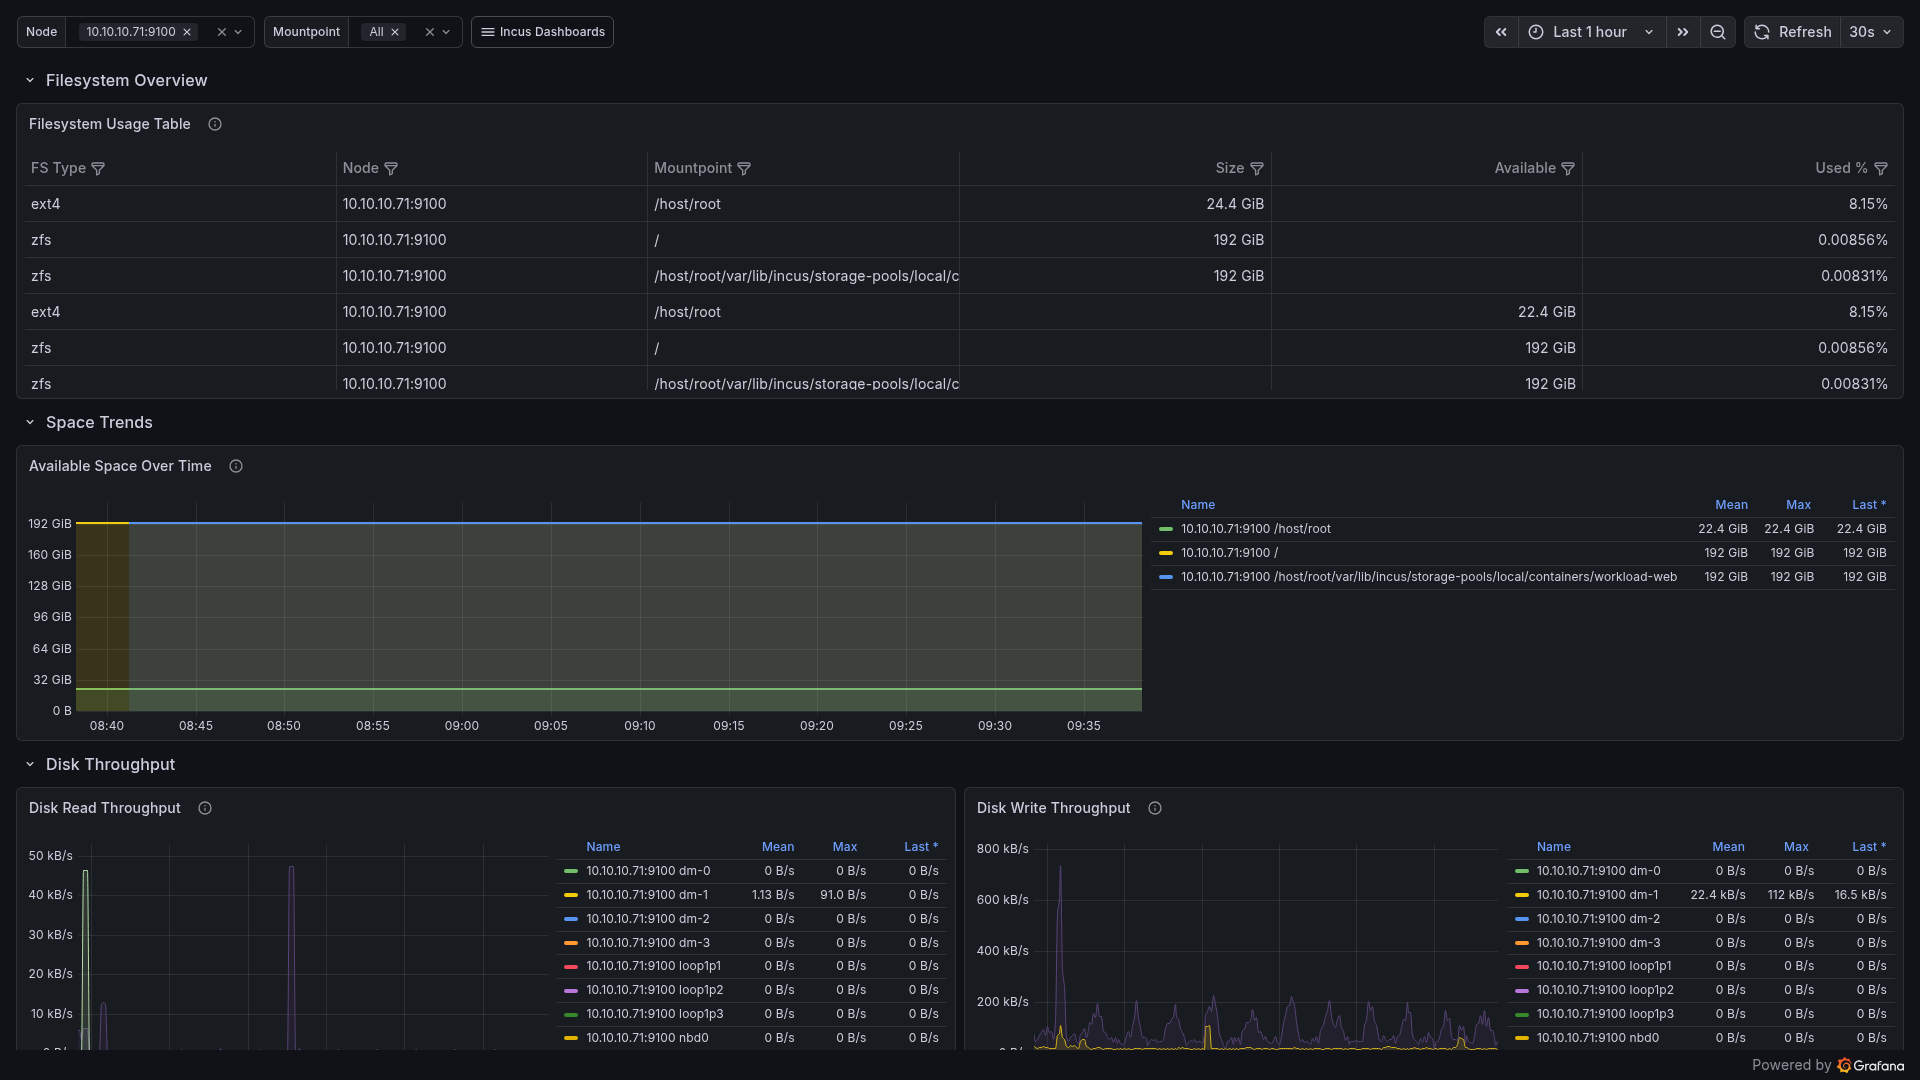 Storage dashboard showing filesystem usage table, available space trends,
disk throughput, and I/O latency across all cluster nodes.
Storage dashboard showing filesystem usage table, available space trends,
disk throughput, and I/O latency across all cluster nodes.
Incus Infrastructure — Network Deep Dive
Network metrics with node/device template variables.
- Cluster ingress/egress/errors/drops summary stats
- Per-node per-device receive/transmit rates
- Instance-level network traffic (Incus
incus_network_*metrics) - Receive/transmit errors and packet drops
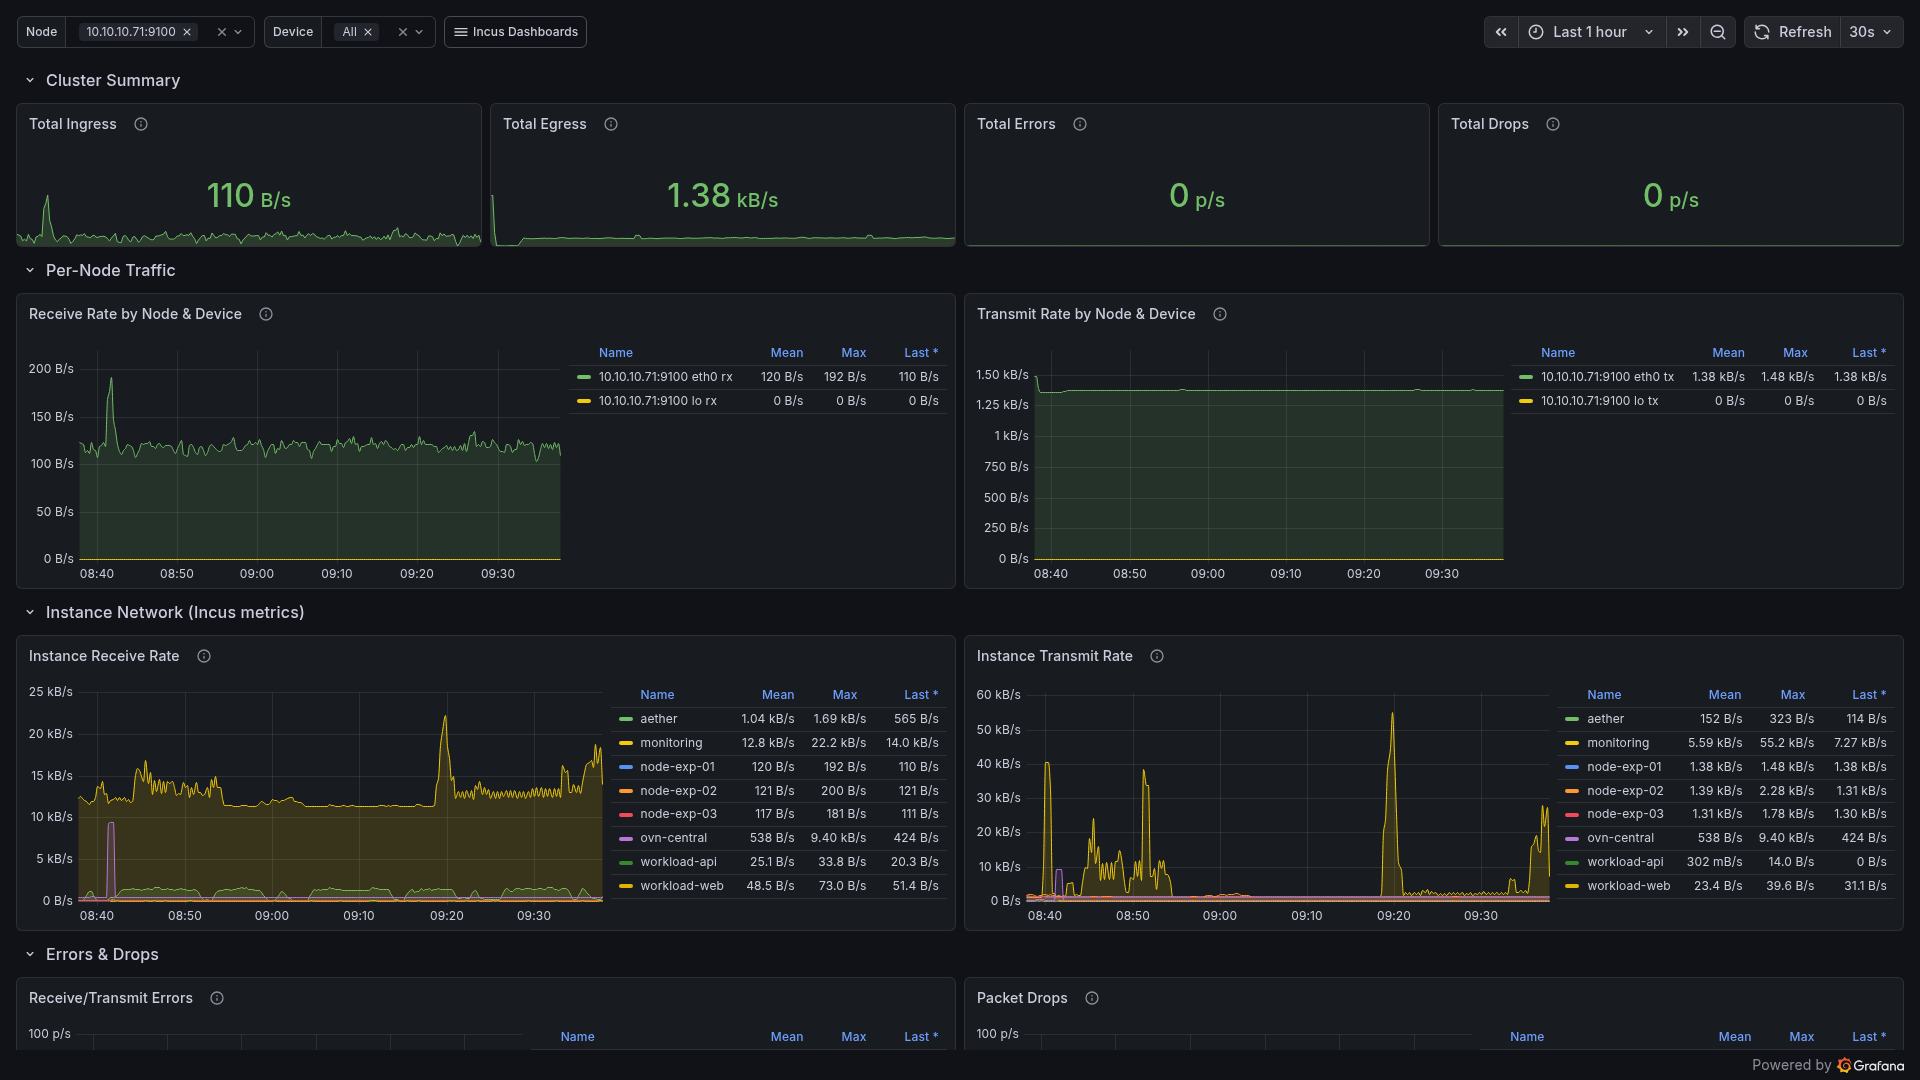 Network dashboard with cluster-wide ingress/egress stats, per-node traffic
breakdown by device, and instance-level network rates for all 8 instances.
Network dashboard with cluster-wide ingress/egress stats, per-node traffic
breakdown by device, and instance-level network rates for all 8 instances.
Incus Operations — Logs Explorer
Log exploration powered by Loki with job/host/unit/search variables.
- Log volume over time (stacked by job)
- Full log stream with search filtering
- Error rate and warning rate by systemd unit
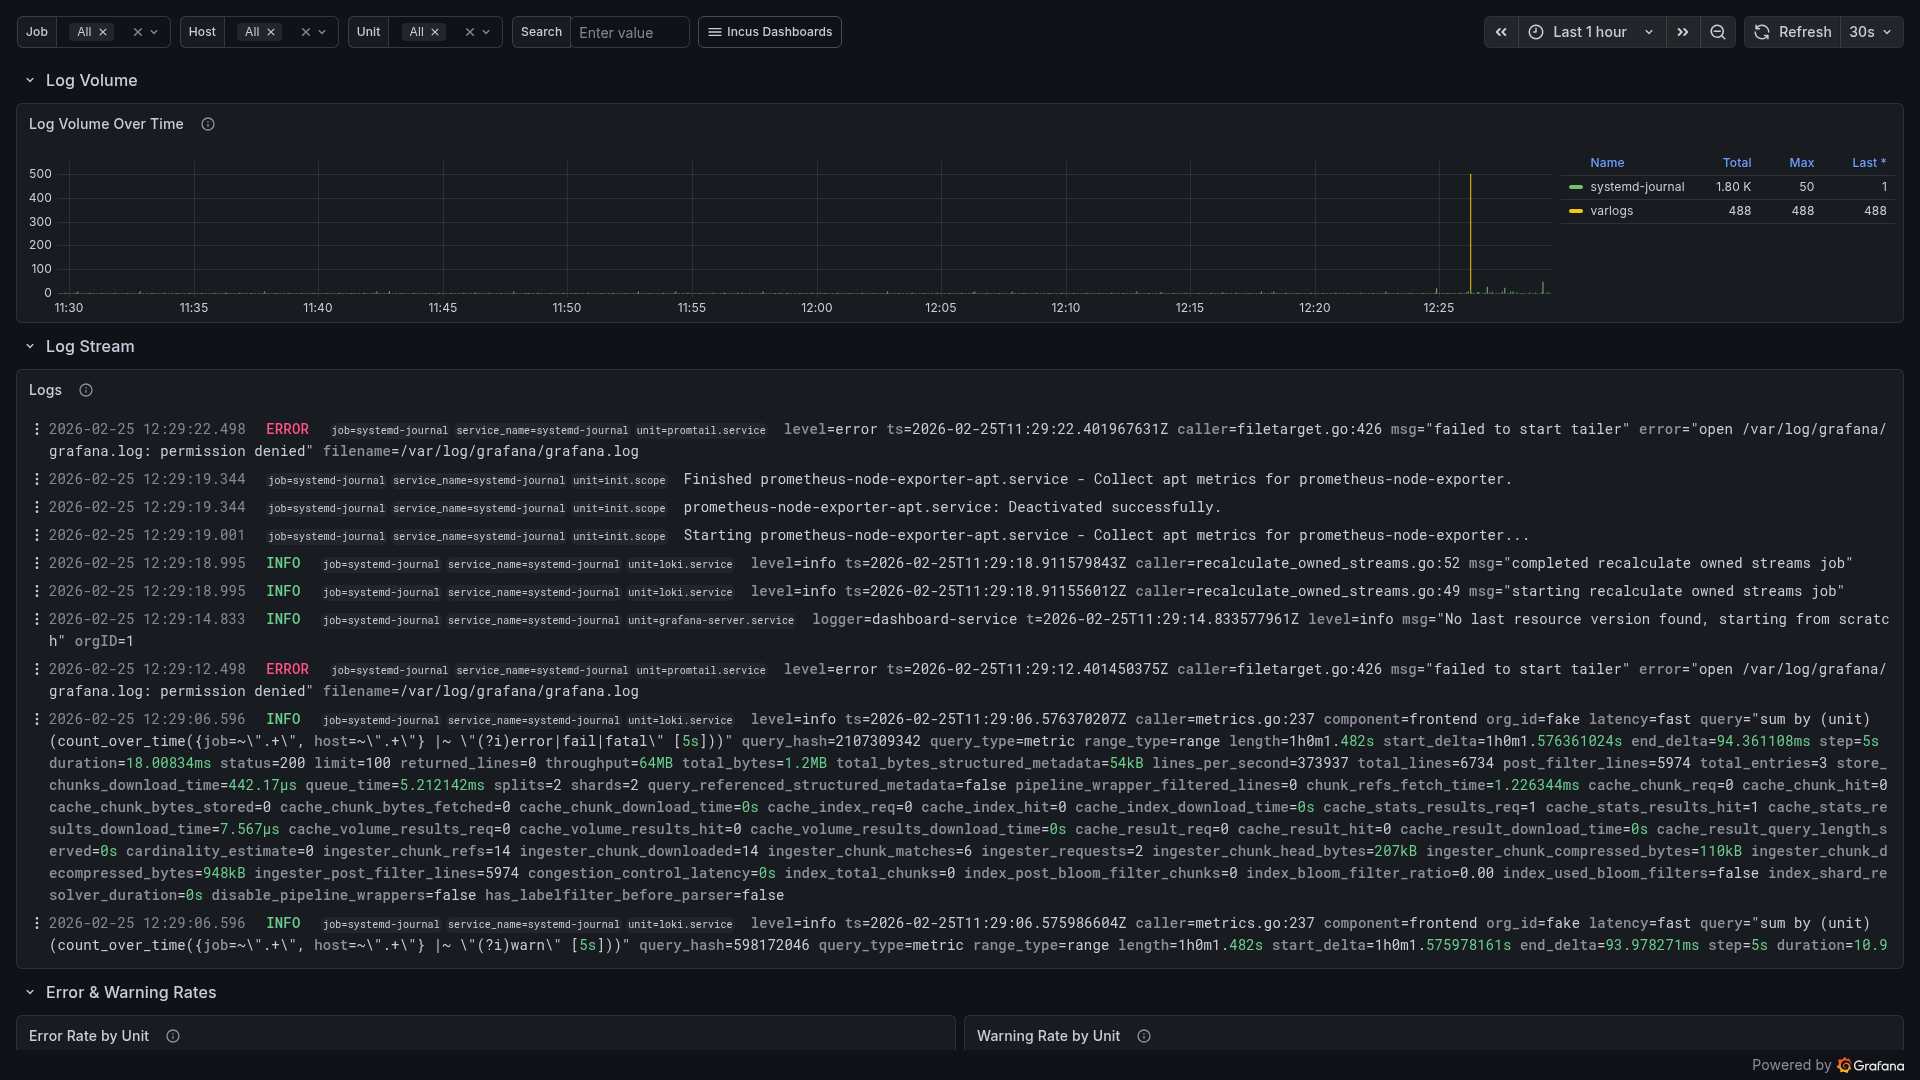 Log exploration showing systemd journal and varlog streams, live log entries
with labels and severity highlighting, and error/warning rates by unit.
Log exploration showing systemd journal and varlog streams, live log entries
with labels and severity highlighting, and error/warning rates by unit.
Incus Operations — Prometheus Health
Prometheus self-monitoring (no template variables).
- Targets up/down, average scrape duration, samples ingested/s
- Target health table with UP/DOWN status
- Scrape duration and samples scraped by job
- TSDB size, head series, head chunks, WAL size
- TSDB size trend, samples ingested trend, compactions
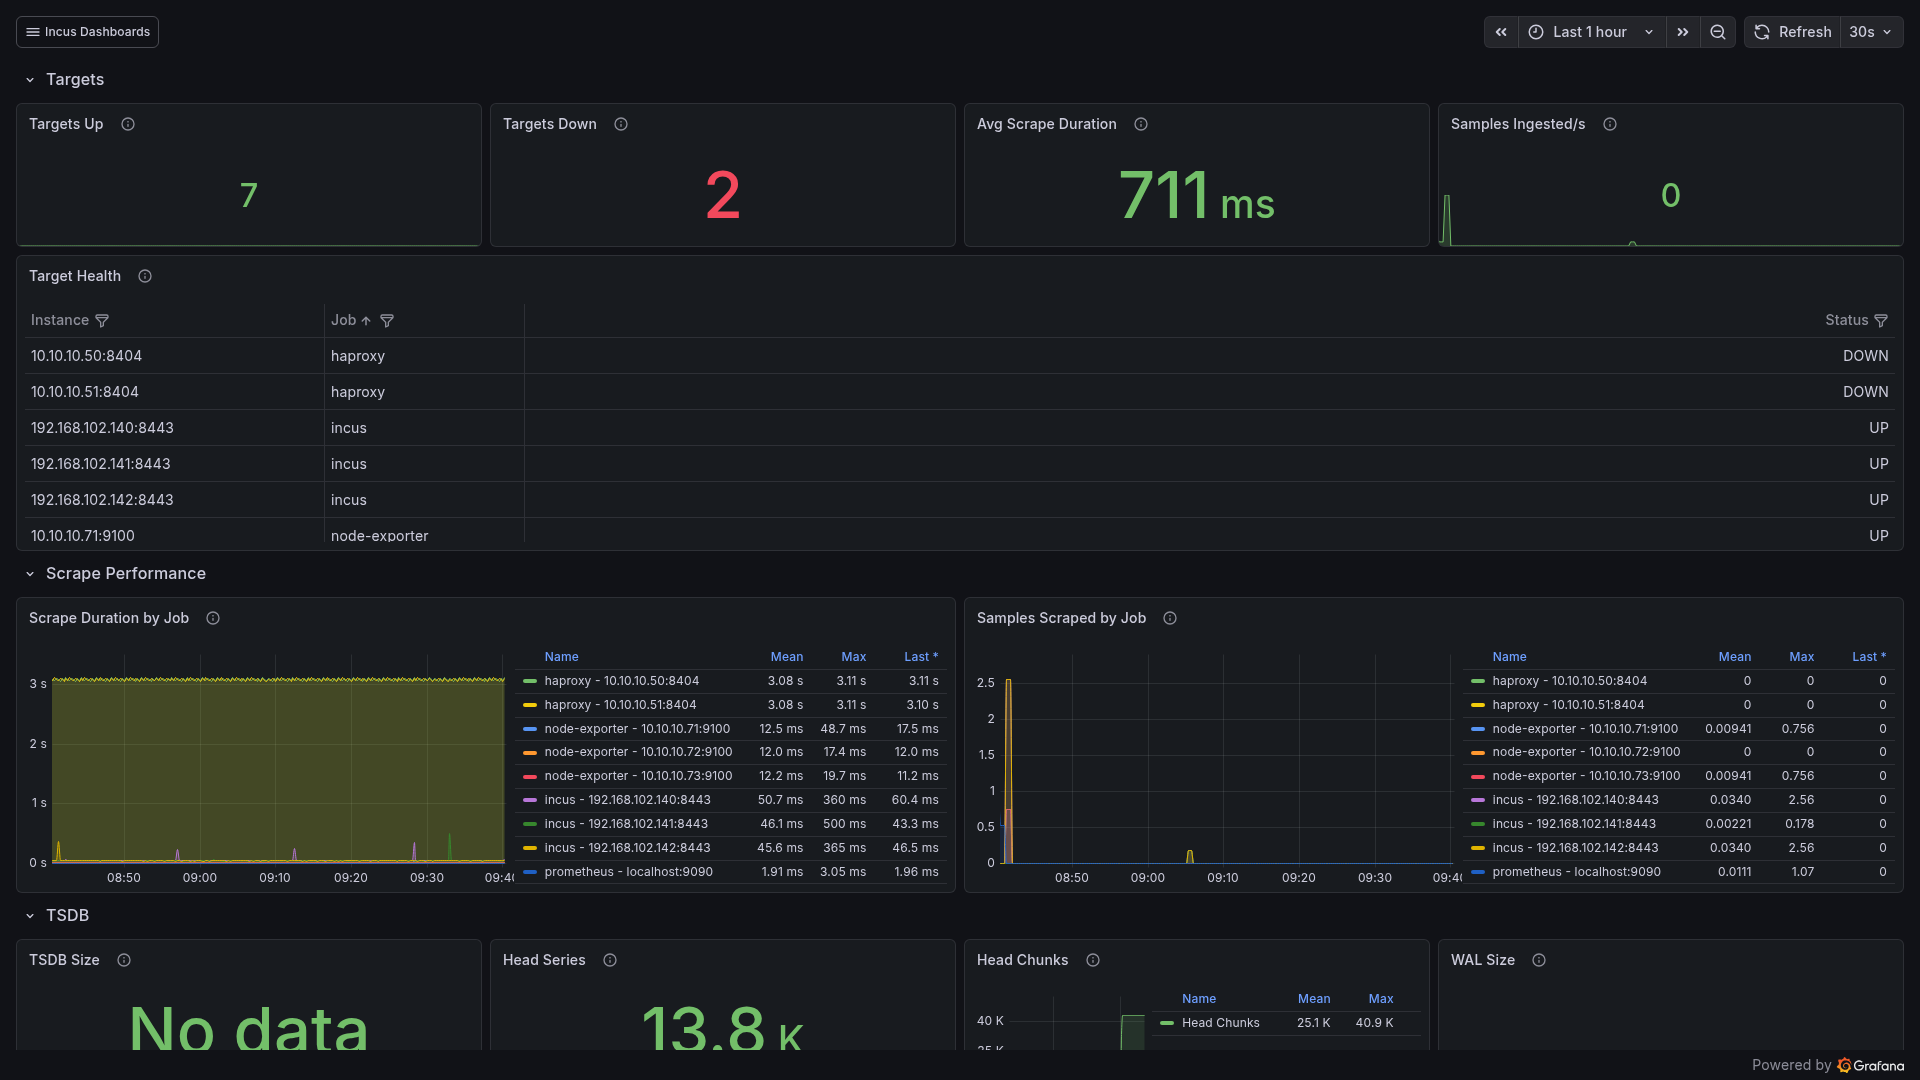 Prometheus self-monitoring showing 7 targets UP (3 Incus, 3 node-exporter,
1 self), 2 DOWN (HAProxy), scrape performance, and TSDB stats.
Prometheus self-monitoring showing 7 targets UP (3 Incus, 3 node-exporter,
1 self), 2 DOWN (HAProxy), scrape performance, and TSDB stats.
Incus Operations — Capacity Planning
Resource planning with 7-day default time range (no template variables).
- CPU and memory headroom per node (inverted bar gauges)
- CPU and memory usage trends (7-day)
- Disk space forecast with 30-day
predict_linearprojection - Instance count trend, memory allocation vs active memory per instance
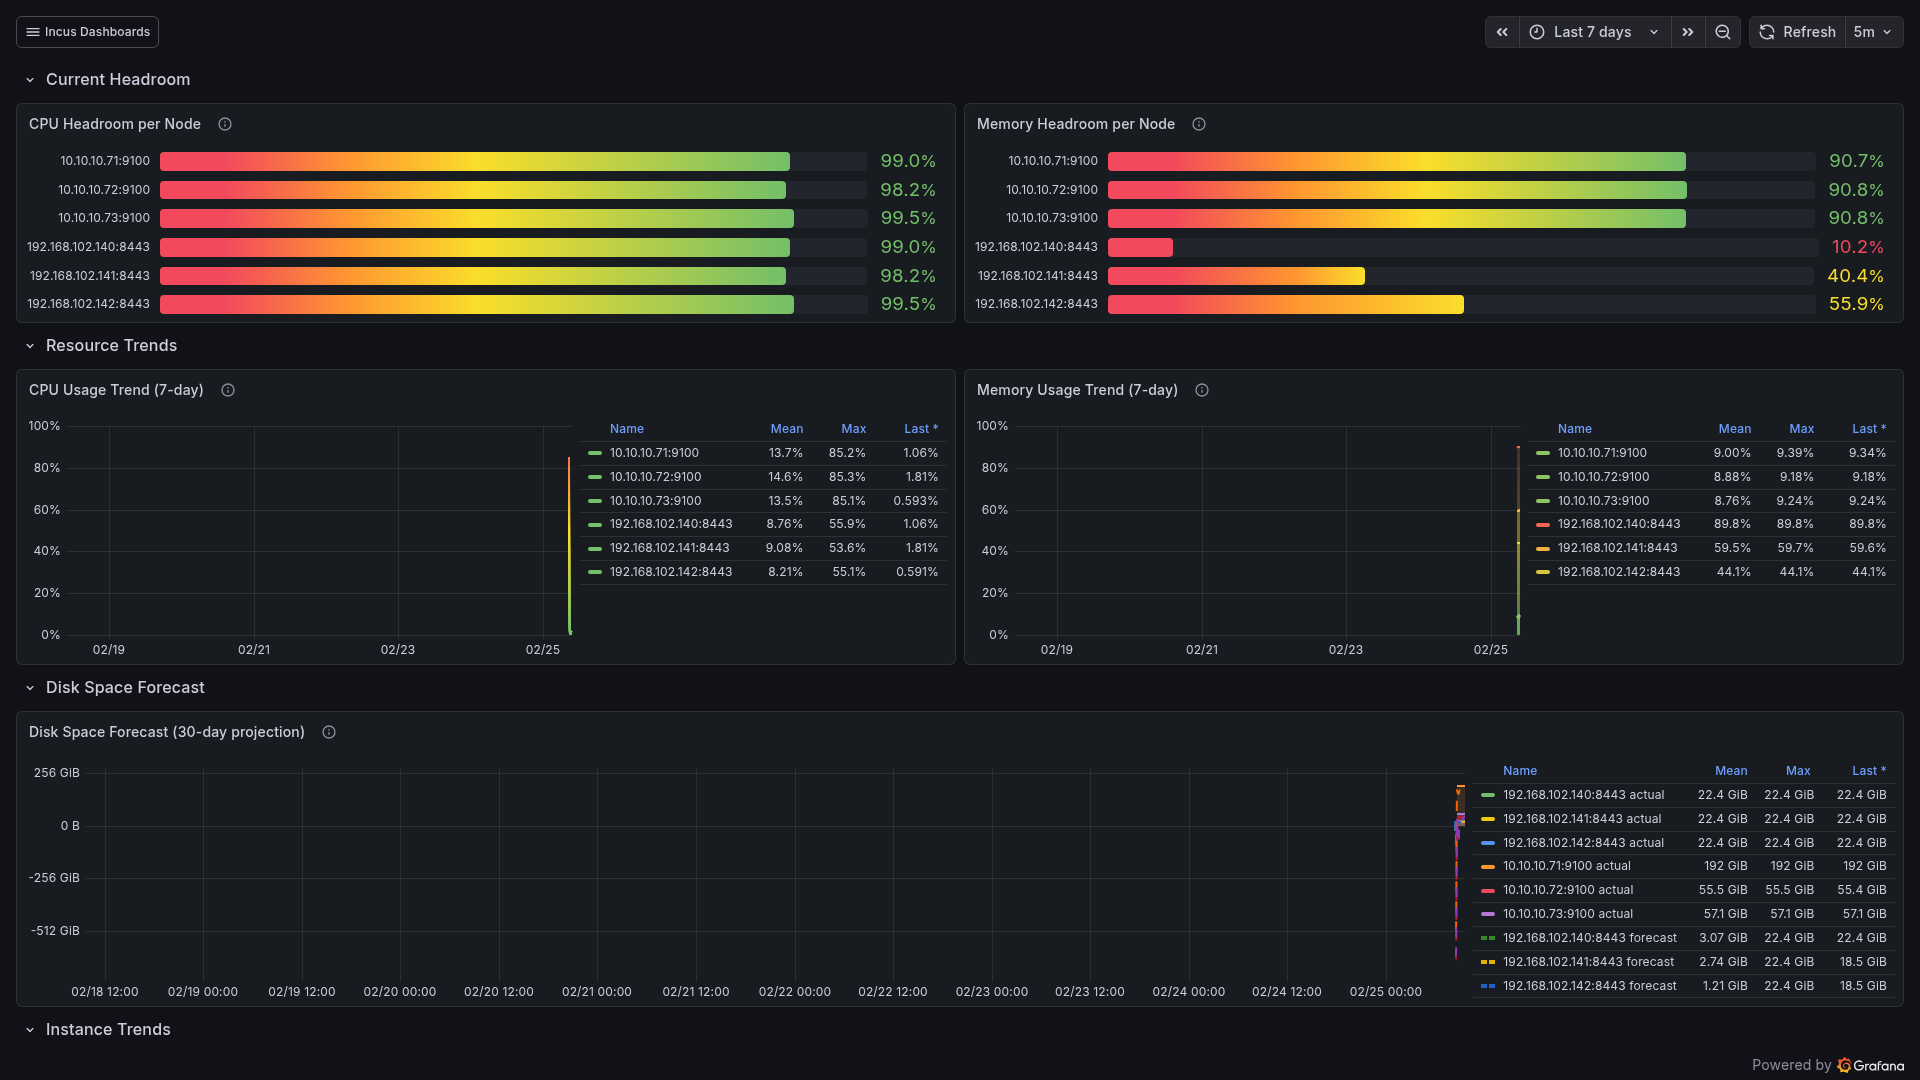 Capacity planning with CPU/memory headroom bars, 7-day usage trends, 30-day
disk space forecast using predict_linear, and instance count over time.
Capacity planning with CPU/memory headroom bars, 7-day usage trends, 30-day
disk space forecast using predict_linear, and instance count over time.
ACL Configuration
Aether automatically creates per-instance ACLs with default-deny rules for all containers on shared OVN networks. The observability stack needs careful ACL configuration to allow scrape traffic.
How Aether ACLs work
When Aether deploys a container, it creates ACLs with reject rules:
| Direction | Priority | Action | Effect |
|---|---|---|---|
| Egress | 111 | reject | Blocks all outbound by default |
| Ingress | 100 | reject | Blocks all inbound by default |
These are OVN ACL rules enforced at the logical switch port level.
monitoring-allow ACL
The observability containers use a monitoring-allow ACL with
default.*.action=allow set on all directions. This creates allow rules
at priority 111 which matches or exceeds the Aether reject rules,
effectively overriding the default-deny policy.
All observability containers (monitoring, node-exp-01/02/03) have this ACL applied.
HAProxy scrape access
HAProxy containers are managed by Aether and have their own ACLs with
default-deny. For Prometheus to scrape HAProxy metrics on :8404, the
HAProxy Aether ACLs need explicit ingress rules allowing TCP traffic
from the monitoring container (10.10.10.70) to port 8404.
Without this, Prometheus targets for HAProxy will show as DOWN.
NIC state after ACL changes
Changing security.acls on a container NIC can cause the NIC to go
down. After modifying ACLs, you may need to bring the NIC back up
manually or restart the container.
Resource Budget
| Container | Image | RAM | Disk | Placement |
|---|---|---|---|---|
| monitoring | Debian/12 | 2 GiB | 20 GiB | oc-node-02 |
| node-exp-01 | Alpine | 128 MiB | — | oc-node-01 |
| node-exp-02 | Alpine | 128 MiB | — | oc-node-02 |
| node-exp-03 | Alpine | 128 MiB | — | oc-node-03 |
Dummy workloads (optional, deployed via --workloads):
| Container | Image | RAM | Placement | Purpose |
|---|---|---|---|---|
| workload-web | Alpine | 128 MiB | oc-node-01 | nginx + CPU/disk/network crons |
| workload-api | Alpine | 128 MiB | oc-node-03 | Python HTTP + memory sawtooth |
Totals:
- RAM: ~2.4 GiB core (2 GiB + 3 x 128 MiB), +256 MiB with workloads
- Disk: 20 GiB (only the monitoring container needs significant storage)
- OVN forward IPs: 1 (192.168.103.201)
- OVN network IPs: 4 core (10.10.10.70-73), +2 with workloads (.80, .81)
Management
The deploy-observability script handles the full lifecycle.
Deploy the stack
incusos/deploy-observability --deploy
Creates the monitoring container and all node-exporter containers, installs and configures Prometheus, Grafana, Loki, and Promtail, provisions dashboards, sets up the OVN network forward, and configures ACLs.
Deploy dummy workloads
incusos/deploy-observability --workloads
Deploys two lightweight containers that generate varied metric patterns:
- workload-web (10.10.10.80, oc-node-01): nginx serving static content, cron jobs generating HTTP traffic (every minute), CPU spikes via gzip (every 5 min), and disk I/O bursts via dd (every 15 min).
- workload-api (10.10.10.81, oc-node-03): Python HTTP server on port 8080, cron jobs for inter-container traffic (every 2 min) and memory sawtooth via 20 MiB allocation/release (every 10 min).
Check status
incusos/deploy-observability --status
Shows the state of all containers (including workloads if deployed), scrape target health, Grafana accessibility, and OVN forward configuration.
Clean up
incusos/deploy-observability --cleanup
Removes all observability containers, the OVN network forward, and associated ACLs. Does not affect monitored targets (Incus nodes, HAProxy).
Health check
incusos/deploy-observability --doctor
Verifies prerequisites, checks container health, validates Prometheus targets are UP, confirms Grafana datasources are working, and reports any ACL issues.
Troubleshooting
Targets show as DOWN in Prometheus
- Check ACL rules on the target containers. Aether's default-deny ACLs block all ingress including Prometheus scrapes.
- Verify the NIC is up. Changing
security.aclscan bring the NIC down. Check withincus exec <container> -- ip linkand bring it up if needed. - For Incus node targets: verify the client certificate and key are correctly placed in the Prometheus config directory and that the cert is trusted by the cluster.
Grafana can't reach Prometheus
Check that Prometheus is running and listening on localhost:9090 from inside the monitoring container:
incus exec monitoring -- curl -s http://localhost:9090/-/healthy
If Prometheus is not running, check its service status:
incus exec monitoring -- systemctl status prometheus
No node metrics
- Verify the node-exporter containers are running and privileged:
incus list node-exp - Check that host filesystem mounts are in place:
incus exec node-exp-01 -- ls /host/proc/stat - Verify node_exporter is listening:
incus exec node-exp-01 -- wget -qO- http://localhost:9100/metrics | head
HAProxy metrics show as invalid or empty
HAProxy needs the prometheus-exporter service enabled in its stats
configuration. The stats section in haproxy.cfg must include:
frontend stats
    bind *:8404
    http-request use-service prometheus-exporter if { path /metrics }
    stats enable
    stats uri /stats
Without the use-service prometheus-exporter directive, the /metrics
path returns HTML stats instead of Prometheus-format metrics.
Loki not receiving logs
Verify Promtail can reach Loki on the gRPC port:
incus exec monitoring -- curl -s http://localhost:3100/ready
Note that Loki uses gRPC port 9096 in this deployment (not the default 9095) to avoid conflicts with Promtail's metrics port.